A University of Melbourne training on Interactive Data Visualisation was held on 17,19 April, 2018.
Observable is a remarkable tool that combines, html control elements, plot.ly data visualisation and javascript calculations to
produce interactive, attractive and reactive calculations and visualisations. See my Observable NBN model here.
See an interesting Observable model of a spinning globe and another(using D3).
See my simpler version here:
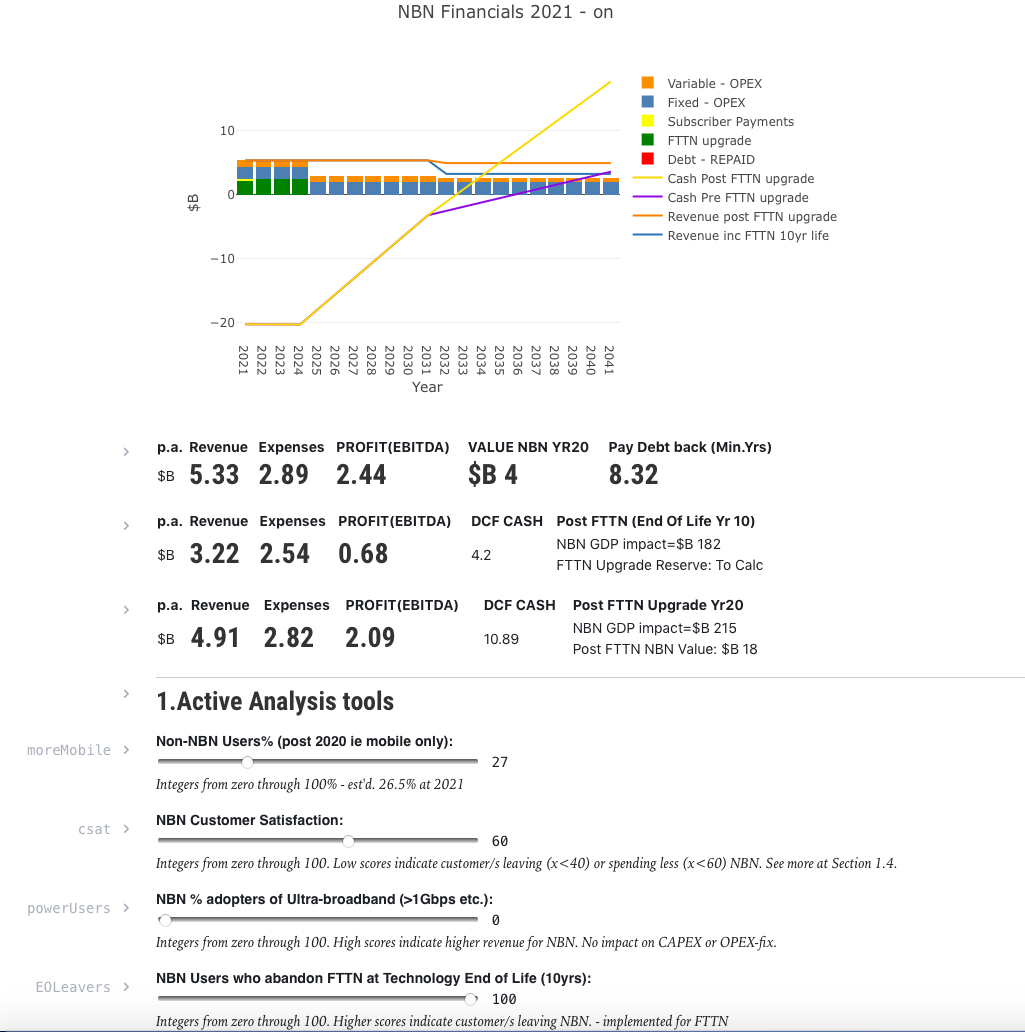
Figure 2. Cashflow Graph, Summary values and Model Sliders (Final Model)
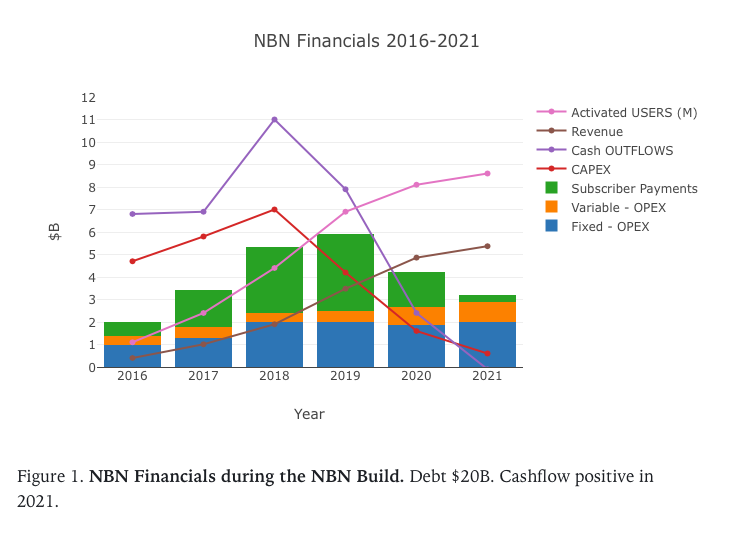
Calculating the value of the NBN
I used Observable to make a dynamic, interactive model to calculate the value of NBN.
I used html sliders to control various assumptions, such as mobile vs fixed broadband use, % of gigabit users, % debt repaid per year.
See Observable and Plot.ly training material, from the Unimelb course, at:
A University of Melbourne training on Plotly.js was held on 22-23 March, 2017. See summary notes here - https://maegul.github.io/DataViz_web_plotly_cheat_sheet/.
The focus was on using the Plotly javascript library to enhance research output.
Focus on interactivity, through buttons, rollovers were useful.
Loading csv files were especially important for me. I loaded two of my datasets below.
Creating a visualisation of FTTN vs FTTP, using an Aster Plot. Strengths: An Aster plot is multi-dimensional like a radar plot, but can assign a weighting to dimensions. Weakness: An Aster plot can only show one Value target at a time. Perhaps I can overlay with photoshop… Update: below I placed two Aster plots side by side, using iframes inside an html table…
To amend the data, and play with the Aster Chart, you need the following files:
Download the files at: https://github.com/areff2000/d3-bubble-plot/tree/gh-pages/valueFlower
style.css |
Data: aster_dataFTTN.csv | aster_dataFTTP.csv
Javascript: drawFTTN.js | drawFTTP.js
Html: indexFTTN.html | indexFTTP.html
Table to draw together two html files into a table with iframe: valueFlower.html (html in this page; View Source)
Discussed at: http://bit.ly/1RiaCpo; Rating of value dimensions in Table 1.
Aster diagram; multidimensional, dimensions vary in weight; scores 0 (Max.) - 100 (Min.)
Following a reviewer’s comment^^, the scale is now revised to: scores 0 (Min) - 100 (Max). Items starred(^^) below now reversed.
Closer to centre indicates less^^ value.
Higher^^ score (in bullseye) indicates more value.
FTTP
FTTN
Key: Dimensions (weight):
CAPEX (25)[Red]
Future CAPEX (10)
Time to rollout (25)
Life of Asset (25)
OPEX / Revenue (20)
Current need (10)
Future need (25)
Reliability (30)
Equity (10)
Simplicity (5)
Beauty (5)
Unknown Unknowns(25)[Blue]
NB: closer to the bullseye is lower^^ value Data: weightings and ratings are author's assessment. Bullseye rating is summary overall; the higher^^ the better.
NB: Yellow - FTTN on a number of dimensions;
NB: Red - FTTP on a number of dimensions;
Now with a reversed scale, per reviewer.
Original: greater value closer to centre.
Amended: greater value closer to edge, greater area.
Future: update to graph showing weightings on significance of each dimension. See for instance Aster Plot here.
Pulsar data is available from ATNF at CSIRO.au. Our team at #SciHackMelb has been working on a #datavis to give researchers and others a novel way to explore the Pulsar corpus, especially through the sound of the frequencies at which the Pulsars emit pulses.
Tony - web dev, php, JavaScript, SQL, phpmyadmin, CDs, html, visualising pulsar
Gary - python tech, visualising sound of a single pulsar
Chris - data manager, accessing CSIRO pulsar data and manipulating it to a useful format
Anderson - SQL
Michael - transforming pulsar coordinates, azimuthal to cartesian
Richard - data analyst, datavis advisor, data management
AAD - R analysis of pulsar distance, frequency distribution
Advisors: CSIRO Jess Robertson (focus on simple, doable outcome), AAD Dr Ben Raymond
Data:
RA - east/west coordinates (0 - 24 hrs, roughly equates to longitude)
Dec - north/south coordinates (-90, +90 roughly equates to latitude i.e. 90 is above north pole, and -90 south pole)
P0 - the time in seconds that a pulsar repeats its signal
f - 1/P0 which ranges from 700 cycles per sec, to some which pulses which occur every few seconds
kps - distance from Earth in kilo-parsecs. 1 kps = 3,000 light years. The furthest data is 30 kps. The galactic centre is about 25,000 light years away i.e. about 8kps.
We plotted RA, Dec on a rectangular screen roughly to see pulsar location.
One of us, Gary, worked on one pulsar data, turning the frequency into sound. A graph shows the variation in pulse between pulses. Another of the team, piotted a histogram of the range of pulsar frequencies, which shows a nice bi-modal distribution. Why is it bi-modal, we will have to ask a pulsar scientist.
What next, still to do
load data, description, images fileset to figshare :: DOI 16.3.16 ; DONE
add overview images as option eg frequency bi-modal histogram
colour code pulsars by distance; DONE
add pulsar detail sound to Top three Observants; 16 pulsars processed but not loaded
add tones to pulsars to indicate f; DONE
add tooltips to show location, distance, frequency, name; DONE
add title and description; DONE
project data onto a planetarium dome with interaction to play pulsar frequencies; DONE kind of, see below
zoom into parts of sky to get separation between close data points; DONE kind of, see below.
set upper and lower tone boundaries, so tones aren’t annoying
colour code pulsars by frequency bins e.g. >100 Hz, 10 - 100, 1 - 10, <1 Hz
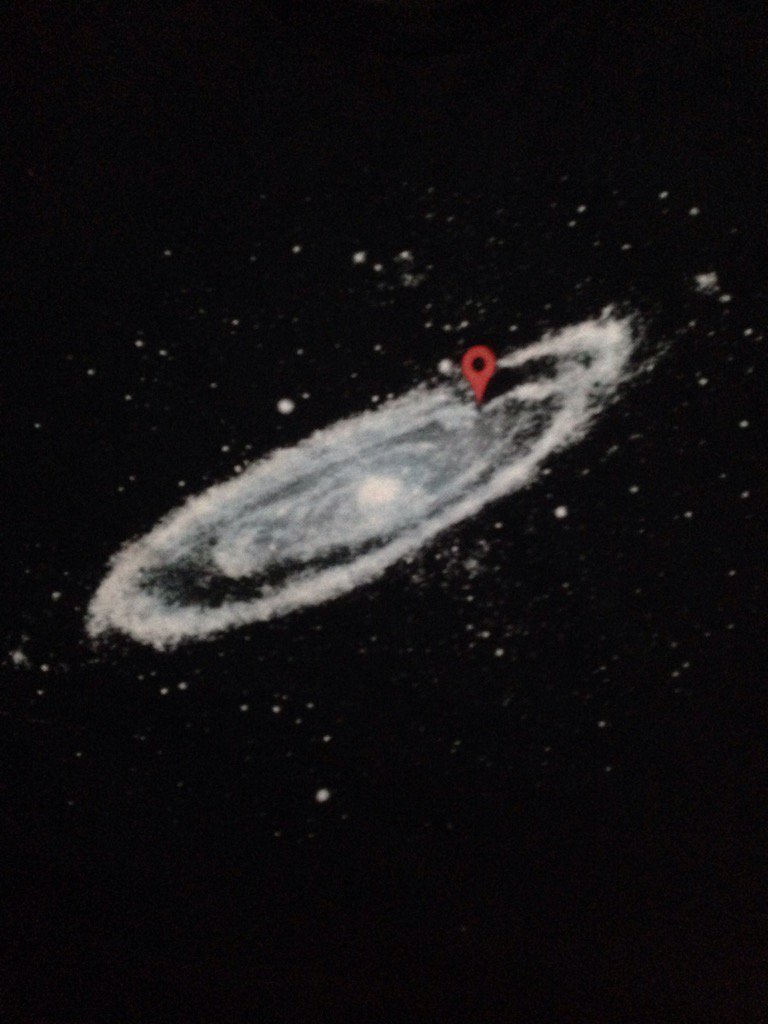
Projected Pulsar location to Google Maps / Google Earth
How to turn Pulsar data into Google map/Google Earth;
Google Drive -> Add new Google Map -> Import -> psrcatSparse.csv -> Add Title, description
Google Maps; maps.google.com -> Login -> Menu -> My Maps -> Select Pulsar Map -> See Map -> Click Earth (bottom left corner). Data projected onto Google Earth. -> Collapse Side Panel
Can rotate, zoom in/out. To see data on map marker; view -> expand side panel.
Doesn’t seem any way to share Google Earth view, but can share Map view.
See Google Map
Status of map: Public on the web - Anyone on the Internet can find and view
Pulsars projected onto Google Earth. NB: now noted that Google capped data upload at 2,000 rows.
Missing points over Atlantic are 296 missing data points. See Google Map link above for reworked data.